Verisyn HQ — Technical Documentation
Revenue Intelligence System
Complete Functional Specification & Capabilities Reference
Executive Summary
The Revenue Intelligence System is a universal, autonomous, multi-dimensional analytics platform built in Microsoft Excel. It transforms raw CRM data into prescriptive vendor management intelligence — identifying exactly which lead sources, reps, markets, and territories are driving retained revenue and which are consuming budget without return. Every source is treated as a vendor with a measurable performance score, a renewal decision, and a clear path to SCALE, OPTIMIZE, WATCH, or PAUSE. No data team. No BI license. No waiting months. Included with every monthly VHQ engagement at no additional cost.
"Every source is a vendor. Every vendor has a performance score. Every score has an action. SCALE, OPTIMIZE, WATCH, or PAUSE."
Most companies treat lead sources as marketing channels. The RIS treats them as vendors — with performance metrics, ROI accountability, and explicit renewal decisions governed by data rather than relationship or habit.
| Traditional View | Vendor Management View |
|---|
| Sources are channels | Sources are vendors delivering a measurable service |
| Performance measured by volume | Performance measured by retained revenue per dollar |
| Relationships are ad-hoc | Relationships governed by SLAs and performance reviews |
| Decisions are reactive | Decisions are data-driven and prescriptive |
| Budget allocated by habit | Budget allocated by performance ranking |
The Vendor Lifecycle
Discovery & Onboarding
Auto-discovery of all lead sources. Vendor registry creation. Initial performance baseline established. Every source categorized by channel, type, and market.
Performance Scoring
LQI scoring per vendor. ROI, CPL, revenue per lead, and close rate tracked against portfolio benchmarks. Trend detection flags movement before it becomes a problem.
Prescriptive Action
SCALE — expand the vendor relationship. OPTIMIZE — performance improvement plan. WATCH — probationary period. PAUSE — suspend or terminate and reallocate budget.
Governance & Review
Monthly vendor scorecards. QBR-ready performance data. SLA monitoring and escalation. Contract renewal recommendations with data-backed rationale.
Reallocation & Optimization
Budget reallocated from PAUSE to SCALE vendors with projected revenue impact. New vendors tested and scored. Continuous improvement cycle with self-optimizing thresholds.
The RIS accepts any CRM export in any format. No predefined column structure is required. The auto-discovery engine identifies every dimension present in the data and configures the system accordingly.
Universal Compatibility
Accepts exports from Salesforce, HubSpot, Zoho, Pipedrive, JobNimbus, MarketSharp, improveit360, and any custom CSV or tabular format. Any column structure. Any data types. Up to approximately 1 million rows.
| Discovered Element | What the Engine Detects |
|---|
| Sources | Every unique lead source — digital, field, affiliate, partnership, referral |
| Markets | Every state, city, region, or territory present in the data |
| Reps | Every sales representative by name or ID |
| Products / Verticals | Every product line — bath, roofing, solar, windows, or custom |
| Custom Columns | Any new column added to the data is auto-detected and catalogued |
| Time Dimensions | Date fields auto-parsed for MoM, QoQ, R12M, and YoY analysis |
The dynamic metadata catalog maps every column to a processing category, assigns scoring rules, and configures weights. New columns added to future exports are automatically incorporated without manual configuration.
The analytics engine produces eight core performance metrics per vendor, five time intelligence views, speed to lead analytics, and a composite Lead Quality Index that governs all prescriptive recommendations.
Vendor Performance Metrics
| Metric | Description | Vendor Equivalent |
|---|
| Total Leads | Volume of leads generated | Units delivered |
| Total Revenue | Revenue from closed deals | Revenue contribution |
| Total Cost | Marketing spend per source | Cost of service |
| Close Rate | Sales ÷ Leads | Quality metric |
| Cost Per Lead (CPL) | Total Cost ÷ Leads | Unit cost |
| Revenue Per Lead | Total Revenue ÷ Leads | Value per unit |
| ROI | (Revenue − Cost) ÷ Cost | Profitability |
| LQI (Lead Quality Index) | Composite score: close rate, revenue per lead, response time, ROI | Overall vendor rating |
Time Intelligence
| View | Description |
|---|
| Month-over-Month (MoM) | Current month vs. previous month — primary trend signal |
| Quarter-over-Quarter (QoQ) | Seasonal performance comparison and growth tracking |
| Rolling 12-Month (R12M) | 12-month trailing view with moving averages — identifies structural trends |
| Year-over-Year (YoY) | Same quarter last year vs. current — removes seasonality |
| Trend Detection | Automatically flags ↑ UP, ↓ DOWN, or → STABLE per metric per vendor |
Speed to Lead Analytics
Speed to first contact is the single most predictive variable in close rate outside of lead quality. The RIS measures it automatically and identifies Speed Elite reps — those who contact fast and convert at the highest rate.
| Metric | Description |
|---|
| Time to First Contact | Minutes from lead creation to first rep contact |
| Speed Buckets | Elite (0–5 min), Fast (6–15), Standard (16–30), Slow (31–60), Dead (60+) |
| Speed Elite Identification | Reps who contact fast AND convert above portfolio average |
| Speed vs. Close Rate | Visual correlation showing impact of response time on conversion |
Predictive Lead Scoring
| Factor | Weight | Description |
|---|
| Source Quality | 25% | Historical performance of the lead source |
| Product Match | 25% | Product category conversion rate |
| Rep Performance | 15% | Assigned rep's close rate |
| Response Time | 15% | Speed to first contact |
| State Performance | 10% | Market-level conversion rate |
| Historical Match | 10% | Similar leads that converted |
Score Outputs Per Lead
Individual lead score (0–100) · Conversion probability · Projected revenue · Priority (A/B/C/D) · Recommended rep assignment · Action (Call Now / Contact Today / Nurture / Schedule Later)
The decision engine converts performance scores into explicit vendor actions. Every source, rep, market, and territory receives a prescribed recommendation with the reasoning visible behind it.
Scale
LQI > 1,500 and MoM trend stable or rising
Renew and expand the vendor relationship. Increase investment 10–15%. Replicate success factors across other markets.
Optimize
LQI 1,000–1,500 or MoM trend declining
Performance improvement plan. Adjust targeting, messaging, or channel mix. Re-evaluate in 30 days.
Watch
LQI 600–1,000
Probationary period. Monitor trajectory daily. No budget increase until trend confirms improvement.
Pause
LQI < 600 or negative ROI
Suspend or terminate vendor relationship. Reallocate budget to SCALE sources immediately. Document rationale for vendor conversation.
Scenario Simulator
| Scenario | What It Models |
|---|
| What-If Budget Reallocation | Project revenue impact of shifting budget between vendors |
| Market Entry | Project performance of activating a vendor in a new market |
| Rep Assignment | Model impact of routing leads to Speed Elite reps |
| Pause/Scale Impact | Immediate and 90-day ROI impact of acting on a recommendation |
The RIS analyzes performance across six primary dimensions and unlimited custom dimensions. Every dimension produces a ranked output with a prescribed action.
| Dimension | What It Reveals | Primary Decision |
|---|
| Source | Lead origin performance, ROI, CPL, close rate, LQI ranking | Which vendors to renew, expand, or terminate |
| Rep | Individual close rate, speed to lead, source mix, Speed Elite status | Lead routing, comp structure, coaching priorities |
| Marketer | Campaign ROI, creative effectiveness, downstream revenue per owner | Budget allocation by marketing owner |
| Vertical | Product-line close rate, deal size, sales cycle by segment | Go-to-market focus and sales training priorities |
| Market | Geographic performance, source effectiveness per market, MoM trend | Market expansion, contraction, playbook replication |
| Territory | Coverage efficiency, lead density, response time variance | Territory redesign, workload balancing |
Cross-Dimensional Analysis
| Analysis | Description |
|---|
| Source-Market Matrix | Performance of each vendor across every market — identifies where to scale a vendor and where to pause it |
| Rep-Source Mix | Percentage of leads each rep receives from SCALE vs. PAUSE sources — separates skill from lead quality |
| Market-Rep Performance | Rep performance by market — identifies market-specific strengths and coaching needs |
| Source-Vertical | Vendor effectiveness by product line — identifies the right vendor for each vertical |
Unlimited Custom Dimensions
Any column in the CRM export becomes a dimension. Common additions include Channel, Campaign, Product, Lead Stage, Deal Size, Call Outcome, Lead Quality Score, Automation Status, Language or Region, Device Type, and Referral Partner. The auto-discovery engine handles all of them without configuration.
The RIS requires no ongoing maintenance from the operator. The self-diagnostic, self-healing, and self-optimizing engines handle data quality, formula integrity, and threshold calibration automatically.
Self-Healing Capabilities
- ✓Duplicate Removal — Automatically identifies and removes duplicate lead records
- ✓Formula Error Correction — Replaces #N/A, #VALUE!, #REF! with appropriate defaults
- ✓Missing Data Population — Fills missing State, Product, or Source fields with defaults
- ✓Archive Management — Moves data older than 2 years to archive to maintain performance
- ✓File Size Optimization — Keeps working file under 50MB automatically
Self-Optimization
- ✓Threshold Tuning — Automatically adjusts LQI targets based on portfolio performance
- ✓Weight Adjustment — Refines scoring weights based on historical conversion correlation
- ✓Anomaly Detection — Flags sources and markets requiring attention before they deteriorate
The rules engine monitors performance continuously and triggers alerts when conditions warrant attention. Critical alerts escalate to leadership automatically.
| Rule | Severity | Cadence |
|---|
| 80% of sources below average LQI | Critical | Daily |
| Any source LQI dropped >20% MoM | Critical | Daily |
| Any source close rate dropped >15% | Critical | Daily |
| Source volume decline >30% | Critical | Daily |
| Revenue dropped >10% MoM | High | Daily |
| More than 3 sources in PAUSE status | High | Daily |
| Rolling 12-month trend negative | High | Weekly |
| Any rep close rate <5% | Medium | Weekly |
| New source with LQI >2,000 | Low | Daily |
| Source volume growth >25% | Low | Daily |
Alert Routing
Critical alerts escalate to Owner and VP level. High alerts route to marketing and sales leadership. Medium alerts route to RevOps and analysts. All alerts appear in the alert dashboard with severity, trigger condition, and recommended action.
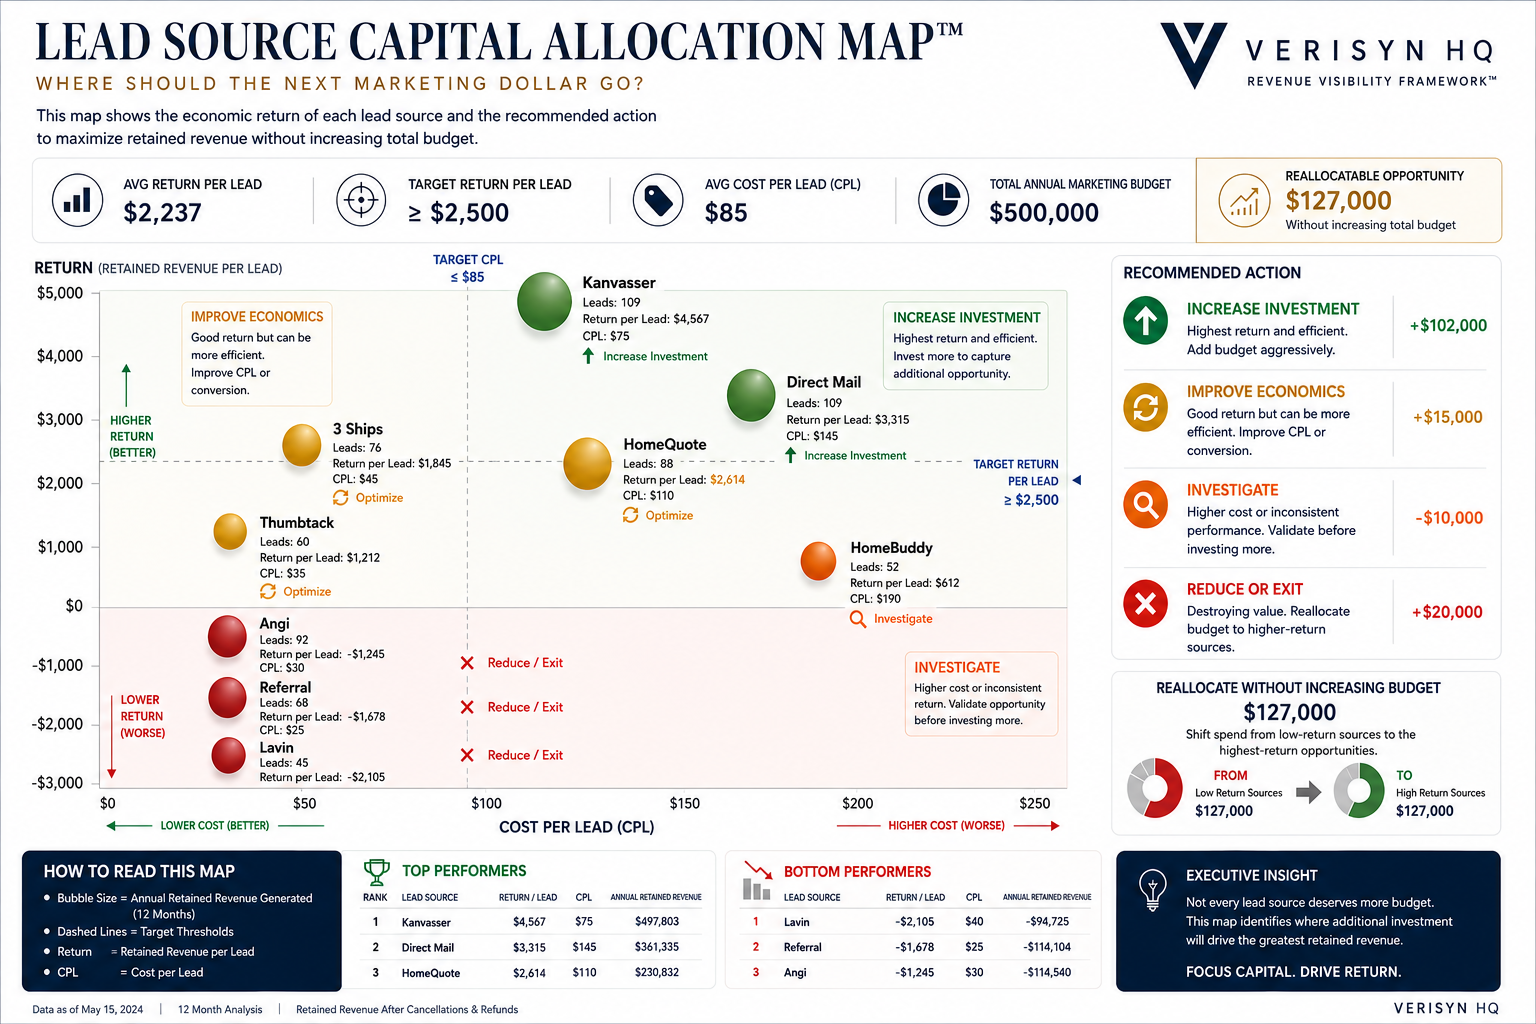
The visualization dashboard provides five distinct views — Executive, Source, Market, Rep, and Speed Analytics — with interactive features including drill-through, dark mode toggle, and one-click PDF export.
Static representation of a live RIS output. The Capital Allocation Map is interactive, drill-through enabled, and updates automatically as new data flows in. Source names are illustrative.
Dashboard Views
| View | Primary Content |
|---|
| Executive KPIs | Portfolio LQI, Total Revenue, Total Leads, Close Rate, Avg Response Time, Portfolio ROI — all real-time |
| Source Performance | LQI Leaderboard, Revenue Waterfall, ROI by Source, Status Distribution (SCALE/OPTIMIZE/WATCH/PAUSE) |
| Market Performance | State/city/market comparison, top and bottom source per market, market action recommendations |
| Rep Performance | Close rate by rep, % from SCALE sources, Rep LQI, Rep Status (TOP/SOLID/DEVELOPING/COACHING) |
| Speed Analytics | Speed vs. Close Rate correlation, Speed Elite leaderboard, market speed comparison, speed bucket distribution |
Interactive Features
- ✓Slicers — Filter by Status, Trend, Product, State, Rep across all views simultaneously
- ✓Drill-Through — Double-click any chart element to see underlying data
- ✓Dark Mode — One-click theme toggle for presentation environments
- ✓PDF Export — One-click export of the full dashboard as a print-ready document
- ✓Keyboard Shortcuts — CTRL+D (Drill), CTRL+R (Reset), CTRL+F (Refresh), CTRL+E (Export PDF)
The RIS is delivered as part of the monthly Verisyn HQ engagement alongside the Monthly Interpretive Brief. The instrument produces the intelligence. The brief delivers the judgment.
Monthly Interpretive Brief
The Monthly Interpretive Brief is not a data summary. It is a decision document. It does not summarize what the RIS produced. It interprets the RIS output through the lens of the diagnosed constraint — identifying which vendor decisions to make this month, which rep routing changes to execute, and which market actions to take. Specific. Actionable. Delivered alongside the updated RIS within 24 hours of data receipt.
Monthly Update Process
| Step | Time | Description |
|---|
| 1. Provide data export | 2 min | Standard CRM export in any format — any columns, any source structure |
| 2. Auto-discovery runs | Automatic | New sources, markets, reps, and columns detected and configured |
| 3. RIS updated and delivered | Within 24 hrs | Six-dimension output with SCALE/OPTIMIZE/WATCH/PAUSE recommendations |
| 4. Monthly Interpretive Brief delivered | Within 24 hrs | Written interpretation with specific vendor decisions and action items |
Power Automate Integration
Optional automation via Microsoft Power Automate — weekly email with KPIs and action items every Monday at 8:00 AM, auto-refresh on file open, automatic backup on Sunday at 3:00 AM, and auto-import of new CSV files from a watched folder.
Requirements
| Component | Requirement |
|---|
| Operating System | Windows 10 or newer / macOS with Excel for Mac |
| Excel Version | Microsoft Excel 2016 or newer / Excel 365 recommended |
| File Format | .xlsm (Macro-Enabled Workbook) |
| Memory | 8GB+ RAM recommended for large datasets |
| Data Input | Any CRM export — CSV, XLSX, or tabular format |
Technology Stack
| Component | Technology |
|---|
| Data Transformation | Power Query (M Language) |
| Analytics | DAX Measures, Excel Formulas |
| Automation | VBA (Visual Basic for Applications) |
| Visualization | Native Excel Charts, Conditional Formatting |
| Delivery Automation | Microsoft Power Automate |
| Storage | Local, SharePoint, or OneDrive |
The following figures are derived from the Verisyn HQ Revenue Visibility Framework applied to home improvement operators in the $3M–$300M range. Results vary by operator, constraint type, and engagement depth.
| Finding | Typical Impact |
|---|
| Underperforming vendor identification | 10–20% budget reallocation from bottom to top vendors within 30 days |
| Speed Elite rep identification | 15–30% close rate improvement through optimized lead routing |
| Market opportunity identification | Expansion into top-performing markets with proven vendor playbooks |
| Rep coaching precision | 20–40% improvement in underperformer close rate with targeted coaching |
| Vendor portfolio optimization | 20–40% reduction in redundant or underperforming vendors |
| QBR preparation time | 80% reduction — data is always current, always formatted, always ready |
Included at No Additional Cost
The Revenue Intelligence System — configured for your sources, reps, markets, and vendors, updated monthly, and delivered with the Monthly Interpretive Brief — is included with every monthly Verisyn HQ engagement at no additional cost. No BI license. No data team. No implementation timeline. Free with a signed engagement.
"The Revenue Intelligence System transforms your lead sources from marketing channels into managed vendors — with performance scores, renewal decisions, and budget reallocation based on data, not habit."